Made In America- Its Not What You Think

February 1, 2021

The Executive Order Ensuring the Future Is Made in All of America by All of America’s Workers has been getting a lot of attention on line as a new effort to drive consumers to buy stuff Made In America. Our close reading of this order however, reveals it to apply only to federal government purchases. We appreciate this initiative, but are dismayed at how little folks seem to know about the various Buy America,  Buy American, Made in America, Made in USA,  phrases, their differences, and their applicability.

explains differences between Made in America, Made in USA, Buy America, Buy American, and Made in USA

Know the difference!

Made in America

President’s Biden  January 25th Made in America Executive Order only applies to the roughly $600 billion in annual federal government procurement spending. It does not apply to commercial sales.

“Made in America Laws” means all statutes, regulations, rules, and Executive Orders relating to Federal financial assistance awards or Federal procurement, including those that refer to “Buy America” or “Buy American,” that require, or provide a preference for, the purchase or acquisition of goods, products, or materials produced in the United States, including iron, steel, and manufactured goods offered in the United States.

Buy America

Is an existing Federal program that applies ONLY to Federal Transit Administration and Federal Highway Administration spending and programs. Include requirements for 100% U.S. content for iron/steel and manufactured products in transportation projects. Exceptions and waivers apply.

Buy American 

Buy American can apply to all federal government purchases (procurement) and governed by each individual agency with oversight from OMB and GAO. Creates a price preference that favors “domestic end products” from American firms on U.S. federal government contracts for manufactured products in which the cost of its U.S. components exceeds 50% of the cost of all components of the item and the product is manufactured in the United States.

Made in USA

Applicable to products regulated under the authority of the Federal Trade Commission (FTC). It is a consumer label claim governed by the Federal Trade Commission. “Made in USA” means that “all or virtually all” the product has been made in America. That is, all significant parts, processing and labor that go into the product must be of U.S. origin. Products that contain more than de minimis amounts of foreign content, including steel or aluminum cannot claim Made in USA on the packaging or marketing materials.

Don’t forget NAFTA /USMCA Country of Origin Labelling

Applicable to products  imported into the United States  governed by Tariff and duty rates enforced by U.S. Customs. Country of origin determination / Identification of the goods is important in determining if a product is eligible for preferential tariff rates, including free trade agreement rates. When a good does NOT come entirely from a single country, the internationally recognized legal principle of substantial transformation is used to determine the origin of the good.

Want to learn more?

Check out our podcast at : Made in America What’s the Difference Podcast

Download our Graphic as a pdf at : Downloadable Graphic

Our thanks to The Franklin Partnership for their assistance.


PMPA November Business Trends Index Better Than 5-year Average!

January 6, 2021

With 75 companies responding, the PMPA Business Trends Index for November increased to 125, This is two
points or 1.6 percent over October’s 123 value. While the rate of growth slowed, it is continuing to grow. The
index is five points above the November 5- year average of 120.2.” – November 2020 PMPA Business Trends Report

November Sales up 48.8 % from April Low! Down slightly from October.

Our November Index is up 48.8 percent from the April low of 84. The October- November decline is lower than that of the prior two years.

Our shops’1.6 percent increase from October to November compares favorably to the Fed’s 0.4 percent increase in industrial production and its 0.8
percent manufacturing output gain for the same period. Our November-February shortfall is 6.0 percent, close
to the Fed’s 5.0 percent lower reading. Fed link

Sentiment Indicators for next three months outlook remained positive for Sales, increased for lead time, employment, and profitability.

A good report!

Link: November 2020 Business Trends Report


October 2020 ISM PMI-Manufacturing Positivity!

November 2, 2020

The manufacturing economy continued its recovery in October. Survey Committee members reported that their companies and suppliers continue to operate in reconfigured factories; with every month, they are becoming more proficient at expanding output. Panel sentiment was optimistic…”Timothy R. Fiore, CPSM, C.P.M., Chair of the Institute for Supply Management® (ISM®) Manufacturing Business Survey Committee.

ISM PMI

Manufacturing continues its sixth consecutive month of recovery.

The manufacturing economy continued its recovery in October. Economic activity in the manufacturing sector grew in October, with the overall economy notching a sixth consecutive month of growth.

  • The October Manufacturing PMI® registered 59.3 percent, up 3.9 percentage points from the September reading of 55.4 percent and the highest since September 2018 (59.3 percent).
  • This figure indicates expansion in the overall economy for the sixth month in a row after a contraction in April, which ended a period of 131 consecutive months of growth.
  • New Orders Index registered 67.9 percent, an increase of 7.7 percentage points from the September reading of 60.2 percent.
  • The Production Index registered 63 percent, an increase of 2 percentage points compared to the September reading of 61 percent.
  • The Backlog of Orders Index registered 55.7 percent, 0.5 percentage point higher compared to the September reading of 55.2 percent.
  • The Employment Index registered 53.2 percent, an increase of 3.6 percentage points from the September reading of 49.6 percent.
  • The Supplier Deliveries Index registered 60.5 percent, up 1.5 percentage points from the September figure of 59 percent.
  • The Inventories Index registered 51.9 percent; 4.8 percentage points higher than the September reading of 47.1 percent.
  • The Prices Index registered 65.5 percent, up 2.7 percentage points compared to the September reading of 62.8 percent.
  • The New Export Orders Index registered 55.7 percent; an increase of 1.4 percentage points compared to the September reading of 54.3 percent.
  • The Imports Index registered 58.1 percent, a 4.1-percentage point increase from the September reading of 54 percent

All indexes reported increases over September.

Fabricated metals reported strong growth.

What’s not to like in this release?

We’re manufacturing positivity!

Chart courtesy Calculated Risk Blog

ISM Report October 2020


August ISM PMI – Manufacturing and Economic Recovery- 4th Straight Month

September 1, 2020

4th consecutive month of manufacturing and economic recovery!

“The August PMI® registered 56 percent, up 1.8 percentage points from the July reading of 54.2 percent. This figure indicates expansion in the overall economy for the fourth month in a row after a contraction in April, which ended a period of 131 consecutive months of growth. The New Orders Index registered 67.6 percent, an increase of 6.1 percentage points from the July reading of 61.5 percent. The Production Index registered 63.3 percent, up 1.2 percentage points compared to the July reading of 62.1 percent. The Backlog of Orders Index registered 54.6 percent, an increase of 2.8 percentage points compared to the July reading of 51.8 percent. The Employment Index registered 46.4 percent, an increase of 2.1 percentage points from the July reading of 44.3 percent. The Supplier Deliveries Index registered 58.2 percent, up 2.4 percentage points from the July figure of 55.8 percent.

“Of the 18 manufacturing industries, 15 reported growth in August, in the following order: Wood Products; Plastics & Rubber Products; Food, Beverage & Tobacco Products; Textile Mills; Chemical Products; Computer & Electronic Products; Primary Metals; Fabricated Metal Products; Machinery; Apparel, Leather & Allied Products; Nonmetallic Mineral Products; Miscellaneous Manufacturing; Electrical Equipment, Appliances & Components; Paper Products; and Transportation Equipment. ”

Manufacturing up four consecutive months!

PMPA’s Latest Business Trends Report for July 2020 shows our industry following this same track.

Chart courtesy Calculated Risk Blog. We’re a fan.


PMPA Podcasts- Monday with Miles

August 7, 2020

We have been told that our new channel is more interesting, as well as useful…


NEW EPISODES ARE UPLOADED EVERY MONDAY!

Technical topics already recorded include Tool Life (Episode # 26, 5 Advantages of Cold Drawn Bars (Episode #19) and What is Machinability (episode #1)

Safety and Regulatory topics already recorded and available for listening include 2 episodes (Episodes #23 &@4)     ) reviewing the Spring regulatory Agenda  covering NLRB, EPA and a host of OSHA items; OSHA inspection Priorities (Episode #18); OSHA Guidance on Face Masks (spoiler alert, they are NOT PPE); and an EEOC discussion  (Episode #16).

Management topics recorded include Committing to Sustain our Business (Episode #27); Business Trends Indicators Prove Positive (Episode #22); and a couple of posts on USMCA  (Episodes (#11 & #15).

Most interesting topics recorded  so far have to be our interviews with People in the industry.  Our Interview with Scott Wiltsie at Vanamatic has been one of our most popular. When you learn  of their absenteeism rate and continuous improvement achievements, you will give yourself a new assignment! (Episode #20).  Our interview with Michael DeVoss of Outokumpu Stainless will broaden your knowledge of machining stainless, and  help you get a free copy of the company’s latest guide for Machining Stainless.

We are keeping these podcasts concise, and informative and also sharing a bit of the fun and joy that we have found in our precision machining work.

Check them out here: PMPA Monday With Miles Podcasts

Our production team includes Carli Kistler Miller as co-host and producer;  Joe Jackson is our Audio Engineer Extraorinaire.

Got a topic you like us to “podcast?” Someone you’d like us to interview? Send your suggestions to Joe Jackson at  PMPA jjackson@pmpa.org

Catch you next Monday-at Speaking Of Precision- Monday with Miles


July ISM PMI 54.2 up 1.6 Over June Second Month in a Row in Positive Territory

August 4, 2020

The July PMI® registered 54.2 percent, up 1.6 percentage points from the June reading of 52.6 percent. This figure indicates expansion in the overall economy for the third month in a row after a contraction in April, which ended a period of 131 consecutive months of growth. “- Timothy R. Fiore, CPSM, C.P.M., Chair of the Institute for Supply Management® (ISM®) Manufacturing Business Survey Committee

This is great news!

July ISM PMI in positive territory for second month in a row.

Of the 18 manufacturing industries, 13 reported growth in July, in the following order: Wood Products; Furniture & Related Products; Textile Mills; Printing & Related Support Activities; Food, Beverage & Tobacco Products; Plastics & Rubber Products; Chemical Products; Apparel, Leather & Allied Products; Computer & Electronic Products; Primary Metals; Petroleum & Coal Products; Miscellaneous Manufacturing; and Electrical Equipment, Appliances & Components.

The New orders, Production , and Backlog of orders indexes  posted increases of 5.1, 4.8, and 6.5 percentage points, respectively.

A welcome and positive sign not only for manufacturing, but the US economy as well.

Manufacturing Optimism!

Chart courtesy Calculated Risk Blog


June PMPA Business Trends Index Up 33% over 2020 Low

July 30, 2020

“This month’s 112 value is 37 points or 49.33% higher than the 2009 Calendar year average of 75 during the Great Recession.  We’re doing alright!”

PMPA Business Trends Sales Recovered in June graph

PMPA Business Trends Sales Index for June 2020 recovers to 112, up 33% over April 2020 Calendar year low!

PMPA Business Trends Sales Index for June 2020 recovers to 112, up 33% over April 2020 Calendar year low!

All forward looking sentiment indicators for Sales, Lead Times, Employment and Profitability were also positive for the second consecutive month

Our respondents’ data showed that we outperformed the FED’s IP and Manufacturing indicators by a large margin.

We are in a far better place this time around then we were during the Great Recession. ( Our Shops’s Sales are currently 49% higher than the Great Recession low)

These difficult times may just be the beginning of the best thing that has happened in manufacturing, as foreign supply chains continue to prove unreliable, and our shops and essential workers step in to fill the need for critical components.


https://www.pmpa.org/news/latest-news/2020/07/29/pmpa-business-trends-june-2020


May Industrial Production FED Reports Gains

June 16, 2020

“Manufacturing output rose 3.8 percent in May, but it was still 16.9 percent below its pre-pandemic level in February. The index for durable manufacturing increased 5.8 percent in May; the most sizable gain among its components was for motor vehicles and parts, where output rose substantially but also remained more than 60 percent below its February level.”

Most sophisticated manufactured goods rely on precision machined parts in order to reliably function. This is great news.

Total industrial production increased 1.4 percent in May, as many factories resumed at least partial operations following suspensions related to COVID-19. Even so, total industrial production in May was 15.4 percent below its pre-pandemic level in February. Manufacturing output—which fell sharply in March and April—rose 3.8 percent in May; most major industries posted increases, with the largest gain registered by motor vehicles and parts.”

In Real Estate, they say the most important thing is  “Location, Location, Location.”

In Economics, I’d like to tell you that it is  “Direction, Direction, Direction.”

And while 1.4%  increase in industrial production may not seem like a lot (Better than most CD’s are paying, come to think of it) the direction is, as they say

“…a turn for the better.”

Industrial Production up 1.4% in May 2020

Markets showing strength 

The major market groups posted broad-based gains in their production indexes in May, but each remained well below its pre-pandemic level.

  • consumer goods rose 3.9 percent, led by a significant rebound for automotive products.[1]
  • production of business equipment rose 5.8 percent and was boosted by a substantial increase in transit equipment as most factories producing motor vehicles and civilian aircraft reopened.
  • The indexes for defense and space equipment, construction supplies, and business supplies also recorded gains.
  • The output of materials decreased 0.8 percent, as the production of energy materials was held down by declines related to oil extraction.

Industry Groups

Manufacturing output rose 3.8 percent in May, but it was still 16.9 percent below its pre-pandemic level in February.

  • The index for durable manufacturing increased 5.8 percent in May; the most sizable gain among its components was for motor vehicles and parts, where output rose substantially but also remained more than 60 percent below its February level.
  • Durable goods industries that recorded production increases between 8 percent and 10 percent include nonmetallic mineral products, aerospace and miscellaneous transportation equipment, and furniture and related products.
  • The index for nondurables rose 2.1 percent, with advances of around 10 percent or more for textile and product mills, for apparel and leather, for printing and support, and for plastics and rubber products. The output of other manufacturing (publishing and logging) moved up 2.5 percent.

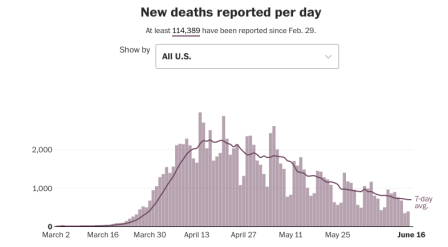
Now the levels are not back to prior Pandemic readings. But we have certainly flattened the curve Virus wise!

Chart from Washington Post reported in AIER

“Direction, Direction, Direction.”  This is why we remain positive.

FED Reserve IP May 2020

What spike? AIER


May ISM-PMI Economy Expanding, Manufacturing Still Contracting

June 2, 2020

“Economic activity in the manufacturing sector contracted in May, and the overall economy returned to expansion after one month of contraction.  “The May PMI® registered 43.1 percent, up 1.6 percentage points from the April reading of 41.5 percent. This figure indicates expansion in the overall economy after April’s contraction, which ended a period of 131 consecutive months of growth.”– Timothy R. Fiore, CPSM, C.P.M., Chair of the Institute for Supply Management® (ISM®) Manufacturing Business Survey Committee


That blue vertical line at the right edge of the chart- indicates recession.


The coronavirus pandemic impacted all manufacturing sectors for the third straight month. May appears to be a transition month, as many panelists and their suppliers returned to work late in the month. However, demand remains uncertain, likely impacting inventories, customer inventories, employment, imports and backlog of orders. Among the six biggest industry sectors, Food, Beverage & Tobacco Products remains the only industry in expansion. Transportation Equipment; Petroleum & Coal Products; and Fabricated Metal Products continue to contract at strong levels,” says Fiore.

It has been our thinking that the economy itself is strong, but the exogenous shock- the impact of not just the corona virus but also the government ordered shutdowns- have caused the current weakness. We believe that the recovery will be positive  based on this underlying fundamental economic strength. Here is how ISM see’s this issue:

A PMI® above 42.8 percent, over a period of time, generally indicates an expansion of the overall economy. Therefore, the May PMI® indicates the overall economy grew very slightly following contraction in April, which ended a 131-month period of growth. The manufacturing sector contracted for the third consecutive month. “The past relationship between the PMI® and the overall economy indicates that the PMI® for May (43.1 percent) corresponds to a 0.1-percent increase in real gross domestic product (GDP) on an annualized basis,” says Fiore.

May 2020 ISM PMI

Graph courtesy Calculated Risk Blog


Ventilator Parts PMPA Making a Difference

March 26, 2020

Our nation has an urgent need for Ventilators, and General Motors, one of the companies charged with retooling to make ventilators, asked a PMPA member if they could make all of the parts needed. Our member brought the prints for the ventilator parts to PMPA to leverage the capabilities of our entire association. The PMPA team submitted the prints to our membership and compiled the list of PMPA members who have the capability and the capacity to produce parts for ventilators.  The list has been submitted to GM, FEMA and The White House, and we have confirmed that at several parts have already been awarded to our members and are in production. As our members report additional capacity and capability we will submit an addendum.


Ventilator parts in production at PMPA member shop in Illinois #makingpartsthatmakeadifference

Manufacturing matters. And local manufacturing can make a local difference. The race to the bottom for the globally lowest price is not helping us in our hour of need. Local solutions can solve Global problems. American Manufacturers are stepping up. We need to keep that in mind after we get through this crisis.