
“Economic activity in the manufacturing sector contracted in May, and the overall economy returned to expansion after one month of contraction. “The May PMI® registered 43.1 percent, up 1.6 percentage points from the April reading of 41.5 percent. This figure indicates expansion in the overall economy after April’s contraction, which ended a period of 131 consecutive months of growth.”– Timothy R. Fiore, CPSM, C.P.M., Chair of the Institute for Supply Management® (ISM®) Manufacturing Business Survey Committee

“The coronavirus pandemic impacted all manufacturing sectors for the third straight month. May appears to be a transition month, as many panelists and their suppliers returned to work late in the month. However, demand remains uncertain, likely impacting inventories, customer inventories, employment, imports and backlog of orders. Among the six biggest industry sectors, Food, Beverage & Tobacco Products remains the only industry in expansion. Transportation Equipment; Petroleum & Coal Products; and Fabricated Metal Products continue to contract at strong levels,” says Fiore.
It has been our thinking that the economy itself is strong, but the exogenous shock- the impact of not just the corona virus but also the government ordered shutdowns- have caused the current weakness. We believe that the recovery will be positive based on this underlying fundamental economic strength. Here is how ISM see’s this issue:
“A PMI® above 42.8 percent, over a period of time, generally indicates an expansion of the overall economy. Therefore, the May PMI® indicates the overall economy grew very slightly following contraction in April, which ended a 131-month period of growth. The manufacturing sector contracted for the third consecutive month. “The past relationship between the PMI® and the overall economy indicates that the PMI® for May (43.1 percent) corresponds to a 0.1-percent increase in real gross domestic product (GDP) on an annualized basis,” says Fiore.”
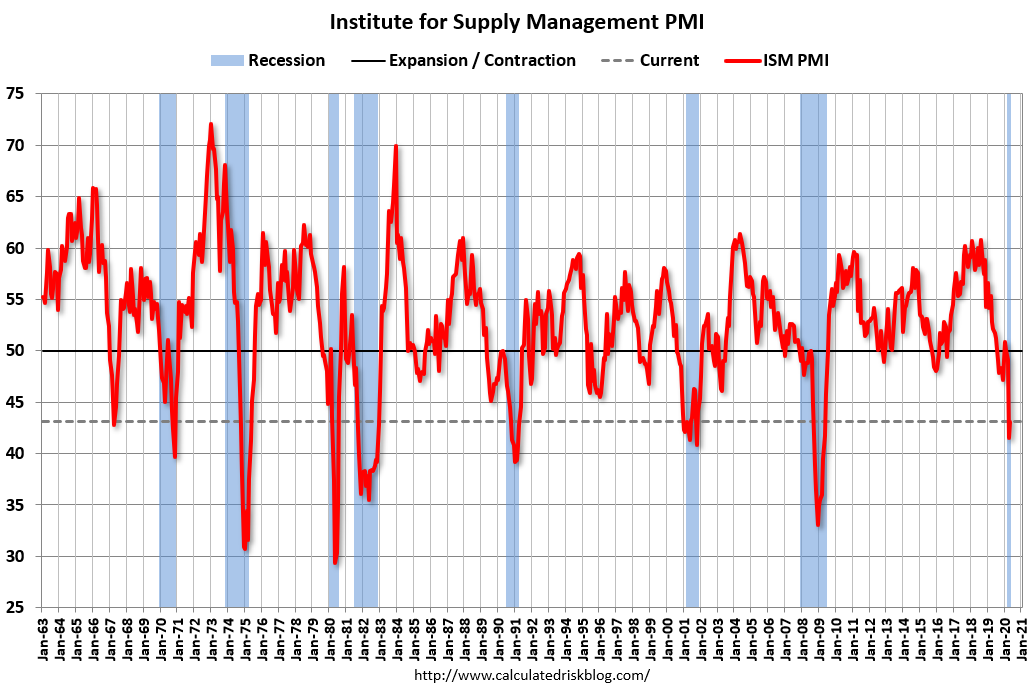
May 2020 ISM PMI
Graph courtesy Calculated Risk Blog