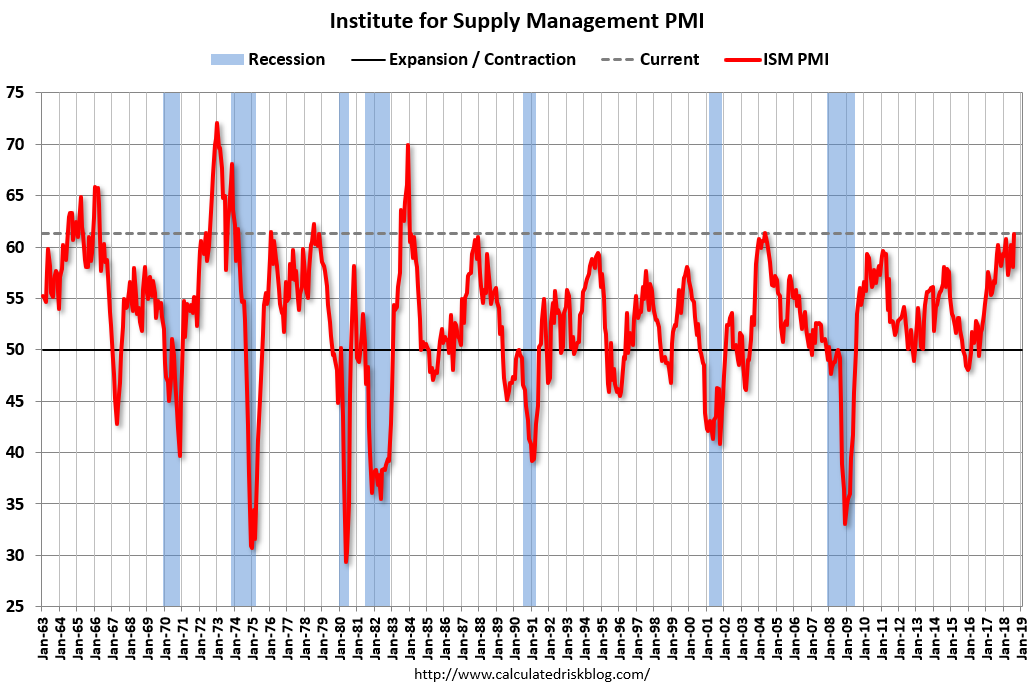
The ISM PMI was reported at 61.3, the highest reading since January 2004, when it was 60.8.
Prior to that the ISM PMI has not been at this level since 1984, when it was 61.3 in February, in 1987 it made it to 61.0 in December.

Here is the ISM’s Announcement:
“The August PMI® registered 61.3 percent, an increase of 3.2 percentage points from the July reading of 58.1 percent. The New Orders Index registered 65.1 percent, an increase of 4.9 percentage points from the July reading of 60.2 percent. The Production Index registered 63.3 percent, a 4.8-percentage point increase compared to the July reading of 58.5 percent. The Employment Index registered 58.5 percent, an increase of 2 percentage points from the July reading of 56.5 percent. The Supplier Deliveries Index registered 64.5 percent, a 2.4-percentage point increase from the July reading of 62.1 percent. The Inventories Index registered 55.4 percent, an increase of 2.1 percentage points from the July reading of 53.3 percent. The Prices Index registered 72.1 percent in August, a 1.1-percentage point decrease from the July reading of 73.2 percent, indicating higher raw materials prices for the 30th consecutive month.” ISM Timothy R. Fiore Press Release
Positive Takeaways:
- Manufacturing continues to expand. the 3.2 point jump from July to August was a substantial increase.
- The overall economy continues to expand- 112 consecutive months of economic expansion.
- The increases from July to August were especially robust for New Orders (up 4.9%); and Production (up 4.8%).
- Other indicators for employment, inventories, supplier deliveries increased on the order of 2% or more.
- The Prices Index fell 1.1 percent in August from July, but still showed increasing costs for raw materials, for the 30th consecutive month.
Thoughts to consider: while past performance is no assurance of future performance, we note that the current level of the PMI has been of prior high water marks, rather than sustainable levels. While “this time it’s different,” is a possible comment, our look at the graph above suggests that we may be nearing the top. Although the values for the 1964-1966 do provide another possible interpretation.
Bottom line: Manufacturing and the broad economy showed remarkable strength in August 2018. Prospects remain positive for sales and employment in manufacturing. The current strong level of performance convinces me that we must be thoughtfully reconsidering all aspects of our business at this time. This trend might have legs- it might also be nearing a top. PMPA’s Latest Business Trend Report was optimistic on Outlook for the next three months.
ISM August 2018
Graph courtesy Calculated Risk