Actually I am amazed at how few broken links I encounter in all of my online research.
But occasionally, we do encounter the challenge of broken links. A broken link- but what can we do to get the material that was supposed to be there?
I use the following process to meet the challenge of a broken link: Deconstruct the broken link into a “likely domain” and the “deliverable Sought.” (In this case a .pdf file.)
So in this case the likely domain was “Nuclear Regulatory Commission,” and the deliverable sought was “BR0470 .pdf” I searched for “Nuclear Regulatory Commission BR0470.pdf “
And Google gave me this :
That top link looks like it! So I followed the top result that Google provided.
Which took me to the page that has a link to the file that I wanted:
This is the page that the google search found. the link we want is the third bullet (look for the pdf icon) I then selected the pdf link on that page which was in fact the deliverable that I was seeking.
Which then delivered this:
NRC Primer on Lean Six Sigma .pdf
Which is the deliverable that I was seeking, and a very good reference on Lean Six Sigma!
That’s my process for dealing with the challenge of broken links keeping me from the information that I want. What’s yours?
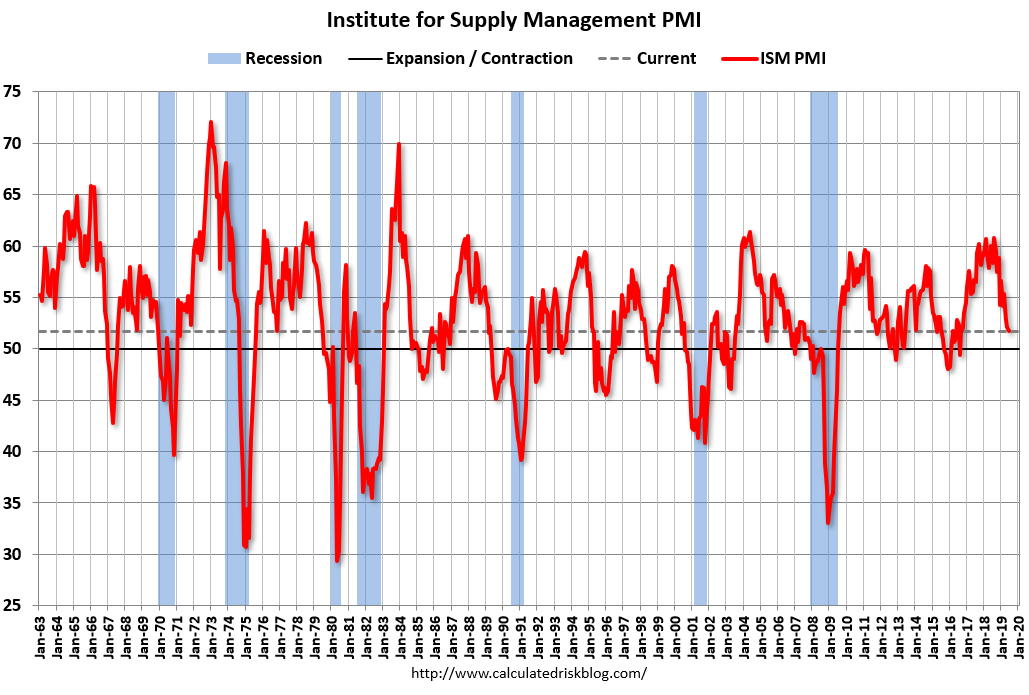
After 35 consecutive months of growth, the Institute for Supply Management’s Purchasing Manager’s Index (PMI) contracted in August 2019, coming in at 49.1% (Readings above 50% indicate growth or expansion in the sector.) Last month, it was at 51.2
After 35 consecutive months of expansion, manufacturing has a no- growth month. According to the ISM report:
“Comments from the panel reflect a notable decrease in business confidence. August saw the end of the PMI® expansion that spanned 35 months, with steady expansion softening over the last four months. Demand contracted, with the New Orders Index contracting, the Customers’ Inventories Index recovering slightly from prior months and the Backlog of Orders Index contracting for the fourth straight month. The New Export Orders Index contracted strongly and experienced the biggest loss among the subindexes.” “Respondents expressed slightly more concern about U.S.-China trade turbulence, but trade remains the most significant issue, indicated by the strong contraction in new export orders. Respondents continued to note supply chain adjustments as a result of moving manufacturing from China. Overall, sentiment this month declined and reached its lowest level in 2019,” says The Institute’s Timothy R. Fiore.
PMPA analysis
This was below expectations which still had the index above 51%. While proclamations of “recession” are unavoidable in the media these days, we would urge caution about this single data point being a trend. IT HAS BEEN 35 MONTHS SINCE WE HAVE HAD A POINT BELOW 50!
Our latest PMPA Business Trends Report for July showed a slowing of growth in shipments by our shops (3MMA fell below the 12MMA) but the index itself recovered higher and all forward looking three month sentiment indicators turned strongly positive. Mixed Signals
Industries reporting contraction to ISM include several of our markets most heavily served : Fabricated Metal Products;Transportation Equipment; Primary Metals; and Electrical Equipment, Appliances & Components. Here you go.
Our bottom line: The shock should be that we have enjoyed 35 consecutive months of growth, not that we finally had one month of no-growth out of 36! What do you think?
Chart courtesy of Calculated Risk blog
“If slowing growth today means Sales 12% above the prior five years’ average sales for July, we’ll take it.”
With 80 companies reporting, the PMPA Business Trends Index for July 2019 recovered up 3 points or 2.3 percent to 132. While this 132 value is the second lowest value for the year, some context is in order. There were only 4 times where the index was higher than 132 prior to 2018. 132 is a 12.4 percent increase above the Average of July for the past five years, and 104 percent of July 2018 sales.
There are only 4 occurrences of the BT Index exceeding 132 prior to 2018. The July value of 132 is up 12.4% above the average for the past five Years of July. And 4X the Increase of Industrial Production reported by the FED.
We acknowledge that – the 3-month moving average of this sales index has dipped below the 12-month moving average- indicating that the pace of growth in our industry has slowed. At the same time all our forward looking sentiment indicators are Up. UP. UP! Opinions for the next three months compared to today:
Net Sales: Our companies’ outlook for the next three months is strongly positive for the next three months.
Lead Times: The outlook for Lead Times shows that respondents expect to be busy in the coming three months. Ninety percent of respondents expect lead times to remain the same or increase in the next three months. Positive for Sales.
Employment: Sixty percent (60%) of shops reported scheduling overtime in July. Prospects for employment are strongly positive with ninety-seven and a half percent (97.5%) expecting level or increased opportunities for employment.
Profitability: Overall sentiment for profitability shows respondents to be optimistic for the next three months, in line with all other sentiment indicator
2019 has been a very strong year for Sales. July’s recovery to 132, while not sufficient to keep the 3-month moving average above the 12-month moving average, is still a remarkable 12.4 percent increase for sales compared to the five year average of monthly sales for July. Is sales growth slowing? That is what the 3- and 12- month moving averages are telling us. Are we at an enviable level of sales for such a slowdown? I would argue “Yes!” that the current July Sales index of 132 was only exceeded 4 times prior to 2018. Mixed signals appear quite positive to me for the next three months for our precision machining shops.
Here in one tidy place you can find a current list of the most Valuable College Majors.
Many of them will lead to a valuable career in our precision machining shops.
The most valuable college majors include naval architecture marine and nuclear engineering and pharmaceutical sciences. We were pleased to see Mechanical Engineering, Transportation Sciences, and miscellaneous Engineering technologies all included in the top spots. STEM Careers add Value!
The top 10 most valued college majors are:
Naval Architecture And Marine Engineering (Median income: $90,000; Unemployment rate: 1.6 percent, Percent with an advanced degree: 29 percent)
Nuclear Engineering (Median income: $98,100; Unemployment rate: 1.8 percent, Percent with an advanced degree: 56 percent)
Pharmacy Pharmaceutical Sciences And Administration (Median income: $100,000; Unemployment rate: 2.2 percent, Percent with an advanced degree: 58 percent)
Genetics (Median income: $85,000; Unemployment rate: 1.2 percent, Percent with an advanced degree: 76 percent)
Electrical Engineering (Median income: $99,000; Unemployment rate: 2.7 percent, Percent with an advanced degree: 46 percent)
Architectural Engineering (Median income: $74,000; Unemployment rate: 1.5 percent, Percent with an advanced degree: 29 percent)
Aerospace Engineering (Median income: $90,000; Unemployment rate: 2.3 percent, Percent with an advanced degree: 49 percent)
Computer Engineering (Median income: $92,000; Unemployment rate: 2.8 percent, Percent with an advanced degree: 40 percent)
Electrical Engineering Technology (Median income: $76,000; Unemployment rate: 1.8 percent, Percent with an advanced degree: 30 percent)
Materials Science (Median income: $90,000; Unemployment rate: 2 percent, Percent with an advanced degree: 66 percent)
Engineering and Industrial Management(Median Income $72,600; Unemployment rate 1.3%; Percent with an advanced degree: 34%)
General Engineering(Median Income $80,000; Unemployment rate 2.4%; Percent with an advanced degree: 37%)
Applied Mathematics(Median Income $78,200; Unemployment rate 1.8%; Percent with an advanced degree: 49%)
Construction Services(Median Income $70,000; Unemployment rate 1.9%; Percent with an advanced degree: 11%)
Transportation Sciences and Technologies(Median Income $72,000; Unemployment rate 2.2%; Percent with an advanced degree: 20%)
Mechanical Engineering (Median Income $88,000; Unemployment rate 3.0%; Percent with an advanced degree: 39%)
Cut to #22:
22. Miscellaneous Engineering Technologies (Median Income $70,000; Unemployment rate 2.1%; Percent with an advanced degree: 21%)) Our precision machining shops have career opportunities for those who are STEM minded.
As the Bankrate study reports:
Our customers are interested in what is left after we remove the chips. But it is up to us as operators and engineers to understand that there are differences in our chips based on process, material and tooling factors- and what those differences mean. The infamous “Bird’s Nest Chip” Process Differences Turning can result in a long continuous chip, while sawing or milling processes result in shorter chips because of the interrupted nature of the cut. Drilling can result in the chips being recut depending on how the tool is fed and the nature of it’s spiral and means of chip evacuation.
Different materials can drive differences in the chips as well. I’m a steel guy, so my comments are based on that experience, but similar differences will be found in other materials, just based on different factors than Carbon. Material Differences Plain Carbon, Low Carbon Steels (C1008, C1010) tend to generate a more Continuous, Soft Chip. Plain Carbon, Medium Carbon Steels (C1030, C1045) can give a Continuous, Semi-Soft Chip. Plain Carbon, High Carbon Steels yield a Continuous, Hard Chip. Adding alloys can result in a Continuous, Semi-Hard Chip at lower carbon contents (4120) while higher carbon alloy steels can result in a Continuous, Tough Chip (4150) Very High Carbon Alloy steels (52100) give a chip that is both Continuous and Springy.
Having said that, I do not mean to say that all of these steels will result in long stringy chips- it is just that compared to Resulfurized Steels, such as 1117, 1144, 1215, or 12L14, the chips are far less likely to fracture into nice short pieces- often called “6’s or 9’s” or “C’s.” These chips can be described as Broken Semi-Soft (1117) or Broken Semi-Hard (1144) or Well-Broken Semi Hard (12L14, 1215) Process Parameters
Finally, having the speed, feed, depth of cut, and angles on the tools is critical if we are to optimize material removal, minimize chip volume, and keep our process stable and maximize our uptime. Chip control features can also play an important role. ISO 3685 characterizes chips into 8 types- Ribbon, Tubular, Spiral, Washer-type Helical, Conical Helical, Arc, Elemental , and Needle chips. These can then be further described by length (short, long, or snarled). Source ISO 3685
The ISO 3685 standard is a bit pricey, but it will help you to better understand what is going on in your turning process. Of course you can look at the part, but to learn about your processes may I suggest that you take a really good look at the chips?
2019 has been a very strong year for Sales. PMPA’s June Business Trends Sales index 11 point “reversion to the mean” could be considered a substantial drop, but we believe the data suggests otherwise- the Sales Sentiment indicator recovery in June suggests that this is just a ‘moment’ and not a trend. Yes it is an 11 point or 7.8% drop. That arrives at exactly the 5 year average for June 2014-2018. 129
Get more details on why we are unconvinced that this is bad news for our shops at June 2019 PMPA Business Trends
I could give you a lot of stories about how fulfilling my career has been making things that matter. I could give you a lot of stories of the wonderful people that I have met in manufacturing- at all levels of the industry.
But today, I’m just going to provide you with some facts.
In order to have avoid confusion, I am going to use the Gross Domestic Product contribution from Manufacturing as the indicator best describing Manufacturing’s importance to our economy. Some could look at employment or productivity or other indicators, but from my perspective, I believe that how much US Manufacturing contributes to our Country’s GDP is the valid indicator.
The contribution to US GDP from Manufacturing has been growing and on quite a tear since 2009. (The vertical axis is in $ billions, ie.: ”reaching an all time high of 2154.90 USD Billion in the fourth quarter of 2018 from a record low of 1798.60 USD Billion in the first quarter of 2009.” Growing contribution to US GDP.
Chart source: 10 year Chart from Trading Economics United States GDP From Manufacturing
Here is another Trading Economics Chart for United States GDP from Manufacturing since January 2016. Looks like we began to get our stuff together in January of 2017! What is it like for Precision Machining shops like ours?
I personally track a Business Trends Sales Indicator for the Precision Machining Industry Segment. We expect to finish 2019 up almost 20% over calendar year 2016.
Our forecast for 2019 is based on a very strong correlation indicator (r^2 of .96). We believe that we will finish 2019 up 4% over 2018.
And the last two years-2017 and 2018- were both up 7% over prior years.
In addition, all five of our highest months reported-ever- have been in 2018 and 2019.
Why am I bullish on US Manufacturing? As long as people around the world aspire to a USA Middle Class lifestyle, they will need manufactured goods to attain it. And US manufacturing is the third largest segment of contribution to US GDP.
Trading Economics: United States GDP From Manufacturing PMPA Business Trends Report
Sorry for the earworm, fellow Baby-Boomers…
Despite the sense of inevitable doom from all of the pundits, the June ISM PMI data came in at 51.7 (A reading above 50 indicates that the manufacturing economy is generally expanding.) The June report shows the New Orders unchanged, with Production and Employment growing.
Timothy R. Fiore, Chair of the Institute for Supply Management Manufacturing Business Survey Committee reported that “Comments from the panel reflect continued expanding business strength, but at soft levels; June was the third straight month with slowing PMI® expansion. ” (Link below)
After evaluating all factors, the June ISM PMI report concludes that the Overall Economy is growing, albeit slower, for the 122nd consecutive month.
The Manufacturing Sector was also shown to be growing, also slower, for the 34th consecutive month.
We agree that the pace of growth of manufacturing is slowing.
We also believe that there are other reasons to explain this slowing growth besides an imminent recession:
Trade uncertainty– Nothing makes trade more volatile than Tariffs Policy being executed via Twitter.
Trade tensions– Trade with China is a problem much greater than the tariffs issues which we see on the surface. A reset in Global trading order is playing out here, we think.
Geopolitics– Iran, Russia, Brexit- nervous money remains on the sidelines keeping money tight.
Speaking of money– The Fed and its future policy regarding accommodation is also on people’s minds.
Employment– Full employment is typically seen as a positive, but if employers cannot get employees to replace those that they will promote to operate the new equipment, well, it becomes a vicious cycle of a don’t buy the new equipment; b) don’t promote the existing worker; c) don’t hire replacements because we can’t find them. So Full employment actually caps potential for growth.
Finally, Weather. Can’t have a complete list with out mentioning the weather! Much of manufacturing- especially fabricated metal manufacturing- goes into agricultural equipment. The unseasonable rains this year have certainly had an affect on purchase of Farm equipment. We saw headlines late last month indicating half of Ohio Farmland had yet to be planted.
Weather!
So “The Beat Goes On.” 34 months of consecutive growth in manufacturing have been logged, 122 months for the overall economy. We see no imminent triggers for an immediate recession. and as we reported in our latest PMPA Business Trends Report, May 2019 was our fifth highest Monthly Sales Index ever.
We can agree we are at or near a top, but we do not agree that “gloom and doom” are imminent.
Following the pattern of last year, in which we finished up X% year over year, our March 2019 Business trends reports logs a new record of 147, up 14 points or 10.5% over February 2019’s 133. it is up 8.8% over the five year sales index average for March.
This is a new high for our index.
In March of 2018, we posted “…the PMPA Business Trends Index for March 2018 increased 14 points or 10.8% over February to 143, the highest value for the Business Trends Index EVER!” At 143, the index is up 11.2 points or 8 percent above that for the five year average for March Sales index.” Deja vu Sales performance for the precision Machining Industry!
Why this matters:
Our performance and sentiment indicators this month justify our continued optimism about the markets and employment prospects for our precision machining industry in 2019. This auspicious start to 2019 builds a foundation for continued growth and prosperity for our shops in the year ahead.
Oh almost forgot: “Prospects for employment are positive with ninety-four percent (94%) expecting level or increased opportunities for employment.”


