4th consecutive month of manufacturing and economic recovery!

“The August PMI® registered 56 percent, up 1.8 percentage points from the July reading of 54.2 percent. This figure indicates expansion in the overall economy for the fourth month in a row after a contraction in April, which ended a period of 131 consecutive months of growth. The New Orders Index registered 67.6 percent, an increase of 6.1 percentage points from the July reading of 61.5 percent. The Production Index registered 63.3 percent, up 1.2 percentage points compared to the July reading of 62.1 percent. The Backlog of Orders Index registered 54.6 percent, an increase of 2.8 percentage points compared to the July reading of 51.8 percent. The Employment Index registered 46.4 percent, an increase of 2.1 percentage points from the July reading of 44.3 percent. The Supplier Deliveries Index registered 58.2 percent, up 2.4 percentage points from the July figure of 55.8 percent.
“Of the 18 manufacturing industries, 15 reported growth in August, in the following order: Wood Products; Plastics & Rubber Products; Food, Beverage & Tobacco Products; Textile Mills; Chemical Products; Computer & Electronic Products; Primary Metals; Fabricated Metal Products; Machinery; Apparel, Leather & Allied Products; Nonmetallic Mineral Products; Miscellaneous Manufacturing; Electrical Equipment, Appliances & Components; Paper Products; and Transportation Equipment. ”

Manufacturing up four consecutive months!

PMPA’s Latest Business Trends Report for July 2020 shows our industry following this same track.
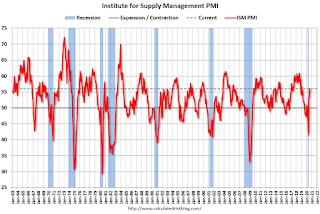
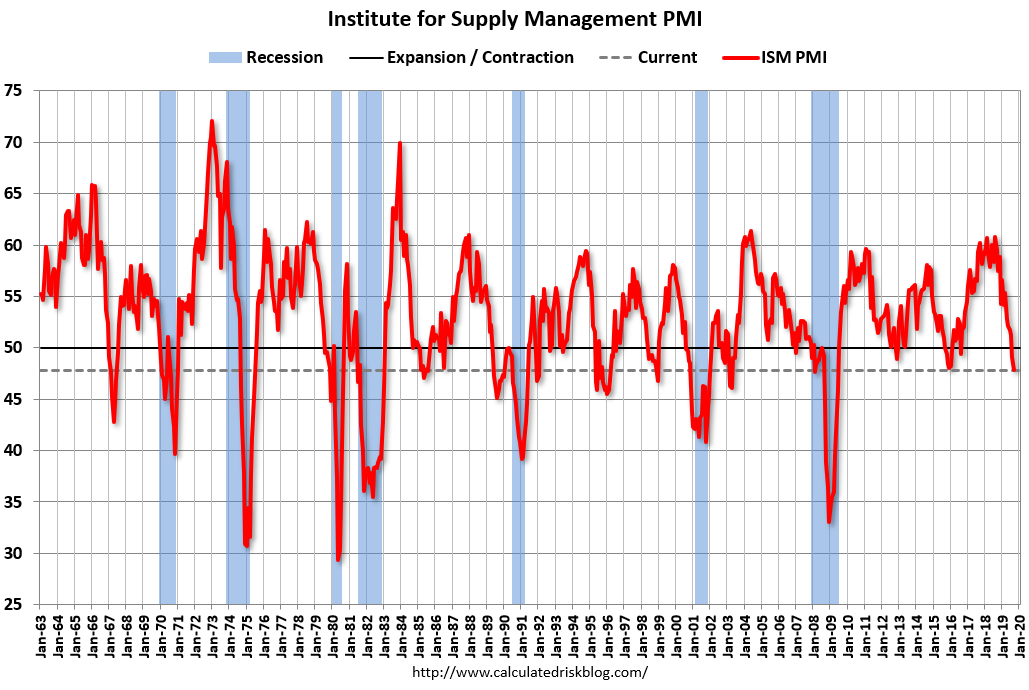
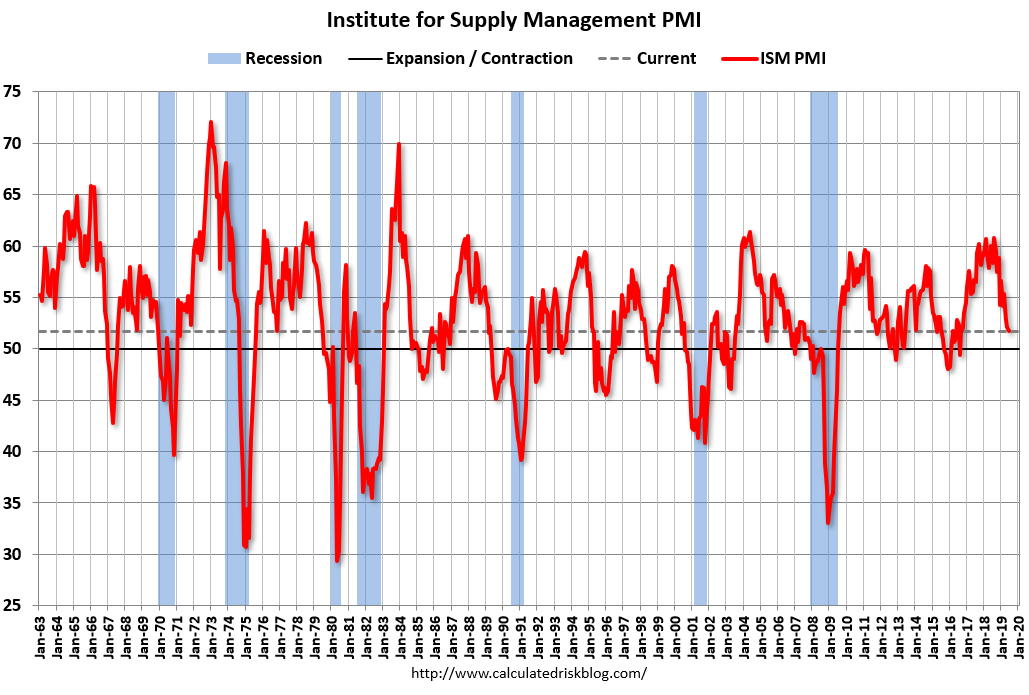
Chart courtesy Calculated Risk Blog. We’re a fan.

The July PMI® registered 54.2 percent, up 1.6 percentage points from the June reading of 52.6 percent. This figure indicates expansion in the overall economy for the third month in a row after a contraction in April, which ended a period of 131 consecutive months of growth. “- Timothy R. Fiore, CPSM, C.P.M., Chair of the Institute for Supply Management® (ISM®) Manufacturing Business Survey Committee
This is great news!

July ISM PMI in positive territory for second month in a row.

Of the 18 manufacturing industries, 13 reported growth in July, in the following order: Wood Products; Furniture & Related Products; Textile Mills; Printing & Related Support Activities; Food, Beverage & Tobacco Products; Plastics & Rubber Products; Chemical Products; Apparel, Leather & Allied Products; Computer & Electronic Products; Primary Metals; Petroleum & Coal Products; Miscellaneous Manufacturing; and Electrical Equipment, Appliances & Components.
The New orders, Production , and Backlog of orders indexes  posted increases of 5.1, 4.8, and 6.5 percentage points, respectively.
A welcome and positive sign not only for manufacturing, but the US economy as well.
Manufacturing Optimism!
Chart courtesy Calculated Risk Blog

“The past relationship between the PMI® and the overall economy indicates that the PMI® for September (47.8 percent) corresponds to a 1.5-percent increase in real gross domestic product (GDP) on an annualized basis,”– Timothy R. Fiore, CPSM, C.P.M., Chair of the Institute for Supply Management® (ISM®) Manufacturing Business Survey Committee
We know that all of the other media will be pointing out the fact that the “ISM PMI for September 2019 did decrease 1.3 percentage points from the August reading of 49.1 percent,” making two consecutive months below 50 and thus contraction in manufacturing. As Abraham Maslow’s often mis- attributed quote states “when all you have is a hammer, everything looks like a nail.” The negative bias in the media these days gives cause for alarm.

The negative bias in the press is extensive these days…

While we acknowledge that the actual ISM PMI for September is 47.8 percent- we remind everyone that this level corresponds to continued GDP growth in the broad economy, not a recession. With the UAW strike and softening Automotive sales, we believe that we have an “assignable cause” and thus lower the weight that this decrease actually has on our thinking.
PMI is down, real US GDP continues to grow

PMPA’s own Business Trends Report shows that shipments of our shops grew 1.5% over July, up 3.8% over this year’s lowest month (June) and are in fact up 4% over the five year average for the month of August. Our August value of 134, would have been the fourth highest month ever for our index, had it occurred prior to 2018.
Softening is not exactly unexpected.
The final quarter of the year is traditionally low for sales and deliveries for precision machining, so we do not anticipate a reversal of the sales trends in the remainder of the year.
Over all, we believe that the bitter taste of the bad news of the 47.8 percent PMI is far worse than the actual reality which is that the economy (real GDP) is continuing to grow.
September 2019 ISM PMI
Calculated Risk Blog- Thanks for the Graph. 
Hammer Lightning

2019 has been a very strong year for Sales.  PMPA’s June Business Trends Sales index  11 point “reversion to the mean” could be considered a substantial drop, but we believe the data suggests otherwise- the Sales Sentiment indicator recovery in June suggests that this is just a ‘moment’ and not a trend.

Yes it is an 11 point or 7.8% drop. That arrives at exactly the 5 year average for June 2014-2018. 129

Get more details on why we are unconvinced that this is bad news for our shops at June 2019 PMPA Business Trends


nostalgic reminder that some things remain the same...
Sorry for the earworm, fellow Baby-Boomers…

Despite the sense of inevitable doom from all of the pundits, the June ISM PMI data came in at 51.7 (A reading above 50 indicates that the manufacturing economy is generally expanding.) The June report shows the New Orders unchanged, with Production and Employment growing.
Timothy R. Fiore, Chair of the Institute for Supply Management Manufacturing Business Survey Committee reported that “Comments from the panel reflect continued expanding business strength, but at soft levels; June was the third straight month with slowing PMI® expansion. ” (Link below)
After evaluating all factors, the June ISM PMI report concludes that the Overall Economy is growing, albeit slower, for the 122nd consecutive month.

The Manufacturing Sector was also shown to be growing, also slower, for the 34th consecutive month.
We agree that the pace of growth of manufacturing is slowing.
We also believe that there are other reasons to explain this slowing growth besides an imminent recession:

  1. Trade uncertainty– Nothing makes trade more volatile than Tariffs Policy being executed via Twitter.
  2. Trade tensions– Trade with China is a problem much greater than the tariffs issues which we see on the surface. A reset in Global trading order is playing out here, we think.
  3. Geopolitics– Iran, Russia, Brexit- nervous money remains on the sidelines keeping money tight.
  4. Speaking of money– The Fed and its future policy regarding accommodation is also on people’s minds.
  5. Employment– Full employment is typically seen as a positive, but if employers cannot get employees to replace those that they will promote to operate the new equipment, well, it becomes a vicious cycle of a don’t buy the new equipment; b) don’t promote the existing worker; c) don’t hire replacements because we can’t find them. So Full employment actually caps potential for growth.
  6. Finally, Weather.  Can’t have a complete list with out mentioning the weather! Much of manufacturing- especially fabricated metal manufacturing- goes into agricultural equipment. The unseasonable rains this year have certainly had an affect on purchase of Farm equipment. We saw headlines late last month indicating half of Ohio Farmland had yet to be planted.

Weather!

So “The Beat Goes On.” 34 months of consecutive growth in manufacturing have been logged, 122 months for the overall economy.
We see no imminent triggers for an immediate recession. and as we reported in our latest PMPA Business Trends Report, May 2019 was our fifth highest Monthly Sales Index ever.
We can agree we are at or near a top, but we do not agree that “gloom and doom” are imminent.
 
June ISM PMI
Farm and Dairy
May PMPA Business Trends 
Calculated Risk Blog 
The Beat Goes on...
The beat goes on…


Sonny and Cher

Following the pattern of last year, in which we finished up X%  year over year, our March 2019 Business trends reports logs a new record  of 147, up 14 points or 10.5% over February 2019’s 133. it is up 8.8% over the five year sales index average for March.
This is a new high for our index.
In March of 2018, we posted “…the PMPA Business Trends Index for March 2018 increased 14 points or 10.8% over February to 143, the highest value for the Business Trends Index EVER!” At 143, the index is up 11.2 points or 8 percent above that for the five year average for March Sales index.”

Deja vu Sales performance for the precision Machining Industry!


Why this matters:

Our performance and sentiment indicators this month justify our continued optimism about the markets and employment prospects for our precision machining industry in 2019. This auspicious start to 2019 builds a foundation for continued growth and prosperity for our shops in the year ahead.
Oh almost forgot: “Prospects for employment are positive with ninety-four percent (94%) expecting level or
increased opportunities for employment.”

The BLS’s Employment Population Ratio was 60.1 in March 2017, its first time back over 60% since February 2009.
February 2009!
This indicator actually shows what it purports to, unlike the U-3 (headline) Unemployment rate.

Not since February 2009…

The U-3 Unemployment rate may actually fall if workers give up looking for work, as the labor market falters. As the labor market is recovering,  the U-3 unemployment rate can rise because more people are re- entering the labor force as they start to look for work again.
The Employment-Population ratio, because it is unaffected by voluntary changes in labor force participation, is a useful indicator of current labor market conditions. Lows in the employment-to- population ratio correspond with economic downturns. The employment-to-population ratio holds clear and discernible implications for the labor market, both among and between segments of the population.
The Employment-Population ratio is a useful indicator. And currently, a positive one.
BLS Employment Population Ratio

Manufacturing Sector continues to grow and strengthen in February according to ISM PMI index, confirming PMPA’s own January Business Trends Outlook.
“Optimism in terms of demand  and growth in the near term”Bradley Holcomb, Institute for Supply Management
“The February PMI® registered 53.2 percent, an increase of 1.9 percentage points from January’s reading of 51.3 percent indicating expansion in manufacturing for the ninth consecutive month. The New Orders Index registered 54.5 percent, an increase of 3.3 percentage points from January’s reading of 51.2 percent. The Production Index registered 48.2 percent, a decrease of 6.6 percentage points compared to January’s reading of 54.8 percent. Inventories of raw materials increased by 8.5 percentage points to 52.5 percent. As in January, several comments from the panel mention adverse weather conditions as a factor impacting their businesses in February. Other comments reflect optimism in terms of demand and growth in the near term.”
Link here
Markets the precision machining industry serves did well in February:  Machinery; Plastics & Rubber Products;  Transportation Equipment;  Electrical Equipment, Appliances & Components; Fabricated Metal Products; Furniture & Related Products; Primary Metals according to the ISM release.
The PMPA’s January Business Trends Report was similarly upbeat with strongly positive indicators for Sales, Lead Times, Profitability and Employment.
Over 59% of our reporting precision machining shops were scheduling overtime in January.
The ISM PMI Report for February 2013  shows continued growth and strength in the manufacturing sector.
proof
The ISM  report confirms  this statement with its report on commodity prices
“No commodities are reported down in price.”
That pretty much validates the index…

The precision machining industry is generating strong sales and positive prospects going into calendar year 2014.

Very strong sales and busy shops characterize the precision machining industry in January 2014

PMPA’s January Business Trends Report’s Index of Sales bounced back up to 126 from December 2013’s high for any December of 100.
January 2014 ‘s 126 was just 2 points shy of January 2013’s 128.
Precision Machining Businesses had a great month in January.
Outlook  for sales remains positive with 87% of respondents expecting the level of sales to remain the same or increase over the next three months.
Profitability is expected to remain the same or improve by 93% of respondents.
Fifty-eight percent (58%) of shops scheduled overtime- 36%  scheduled 45 hours or more.
Get the full report here.
Note: This report was our inaugural issue of the Business Trends Reporting using our newly updated secure, online reporting system. Effective with this move to the new system, we have established the year 2010 as our index base.